
I am in beautiful Hong Kong at the moment for the RenRen ($RENN) CEO conference after a great few days in Amsterdam where I was a keynote for the FintechStage show (proof below):

I put together a lot of charts for my keynote, but it is these three that have me thinking the most about the state of the ‘Fintech’ markets at the moment:
1. Google Trends (no matter which country I search from) shows a parabolic move out of a long base. No wonder the crowd in Amsterdam and wherever I speak these days was full of bankers and corporates and fewer founders.
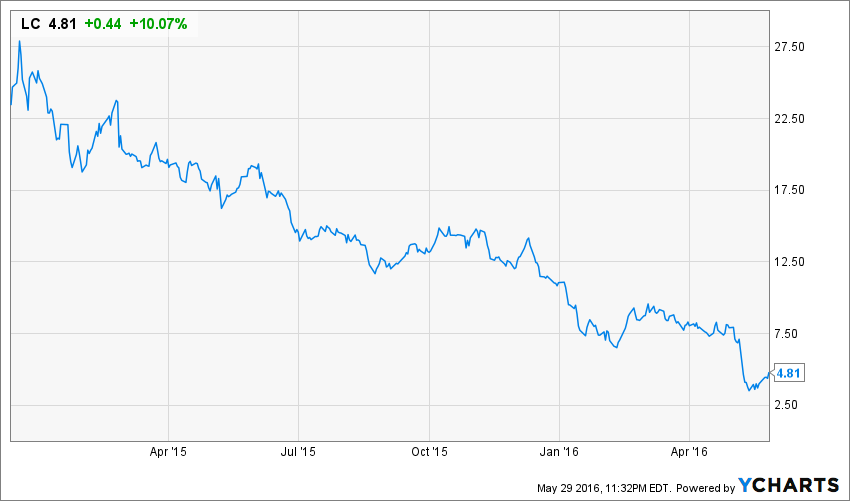
2. Lending Club.. the poster child (company) for peer to peer lending revoution is going in the complete opposite direction to the global Fintech mania underway:
3. The Banks are chasing their way into the space. Their money is green and of course founders can benefit from the knowledge that corporate investors (even bankers) can bring, but I still don’t think it’s a good thing for the sector. In the meantime, their own bank stocks have massively underperformed the S&P the last ‘forever’ years so it was just a matter of time…

These charts can be interpreted in thousands of ways, but reading them as I see them and feel them…I am glad I was focused on this sector way back in 2006 and not chasing my way into fintech deals today.